|
|||||
Database Overview |
|||||
|
ATHENA is a new Greek multi-sensory database for home automation control. In contains real multi-modal data (with emphasis in speech) recorded in a smart home two-room environment as depicted in Figure 1. In total, 20 speakers (10 male and 10 female) participated in the recordings, uttering activation keywords and commands for home automation control and also phonetically rich sentences. In addition, some recording sessions included conversation between two speakers. Audio was captured by 20 traditional condenser microphones distributed on the walls and the ceiling, 6 MEMS microphones on the ceiling and 2 close-talk microphones. Speaker movements as well as gestures were captured by a Kinect camera. In order to better approximate a realistic everyday home scenario, apart from speech, acoustic events and background noises were performed, thus creating adverse noise conditions and rendering the database suitable for experimentation on voice activity detection (VAD), acoustic event detection, source localization, speech enhancement, keyword spotting and distance/far-field speech recognition. |
|||||
Room setup and Positions |
|||||
|
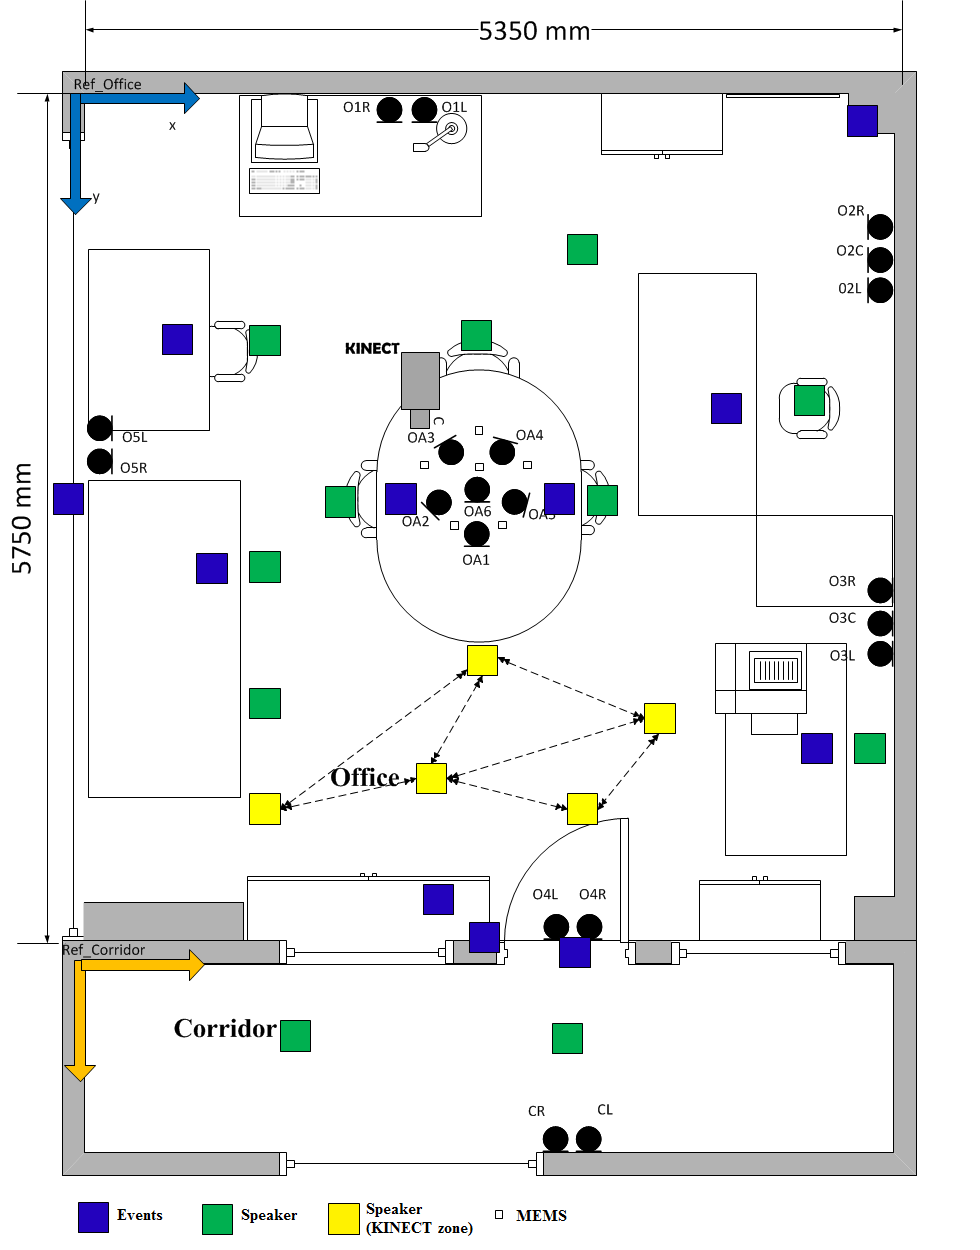
The Athena-RC smart home consists of two rooms: The main room is an office environment and the second room is part of the corridor. A total of 16 different speaker positions with various orientations was used in the recordings. The positions are divided in two zones, Zone A and Zone B depending on whether the Kinect has view of the position or not. Also, for some positions next to a table or desk, we considered both standing and seated speaker. Regarding background events occurrences, we included some positions on tables or next to doors/windows where events took place. All these are depicted in Figure 1 that depicts the floor plan. With black colour are marked the 20 condenser microphones while with white the 6 MEMS microphones. Speaker positions in Zone A (tracked by Kinect) are marked with yellow squares, Zone B with green squares and finally events positions with blue squares. |
|||||
Recording Scenarios |
|||||
|
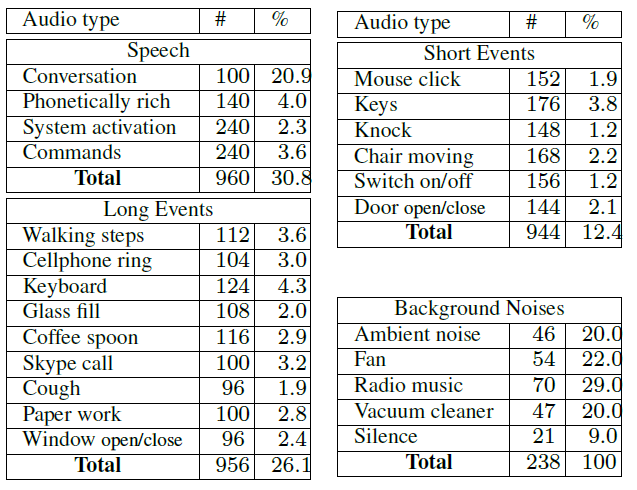
Each one of the 20 speakers participated in twelve 1-min sessions with different settings each. Thus, the whole database duration counts up to 240 minutes. Concerning audio, the scenarios include various speech types, acoustic events and noises, whose statistics are presented in Table 1. It should be noted that about 40% of speech overlaps with background events. |
|||||
|
|||||
|
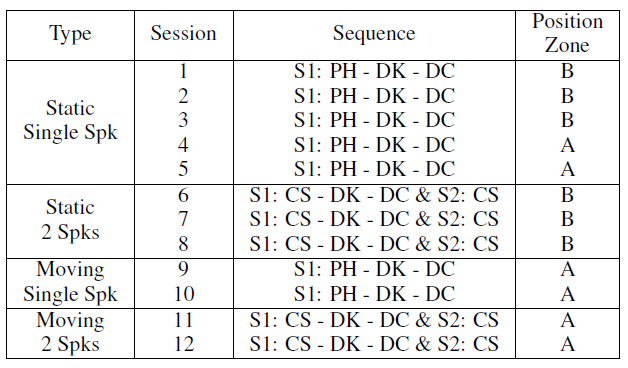
Also, the various speech types, acoustic events, noises, speaker positions and events positions were randomly distributed into the 240 minutes. In each session, one long and one short event takes place with four instances each. Also there may be a background noise or just silence. Table 2 presents each different session. |
|||||
|
|||||
Visual Data |
|||||
|
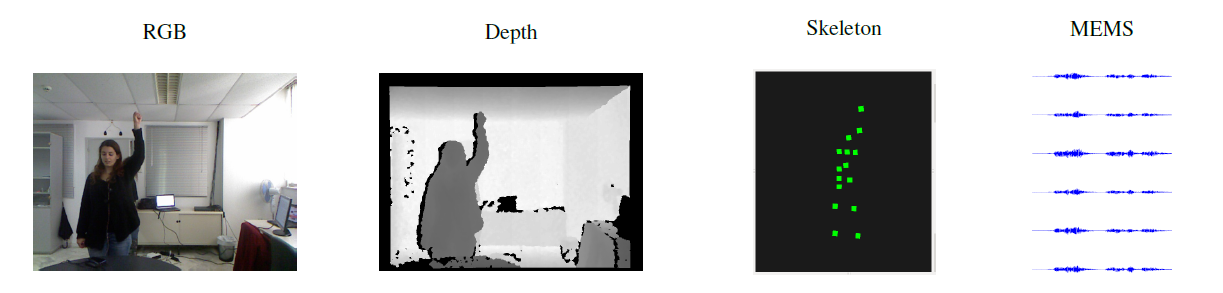
Apart from audio data, we also recorded visual data using a Kinect camera. Specifically, we recorded three Kinect streams, the RGB, Depth and Skeleton. For purposes of multi-modal processing and interaction, as well as to further aid a system activation and keyword spotting process, we introduced a gesture while the speaker was uttering a keyword in Kinect sessions. The gesture type was a raised hand in fist in order for the Kinecto to be able to track it independently of the speaker's orientation. An example can be found in the following figure, where the 3 Kinect streams (RGB, Depth and Skeleton) are being depicted along with the MEMS output for a keyword instance. |
|||||
|
|||||
Data annotation |
|||||
|
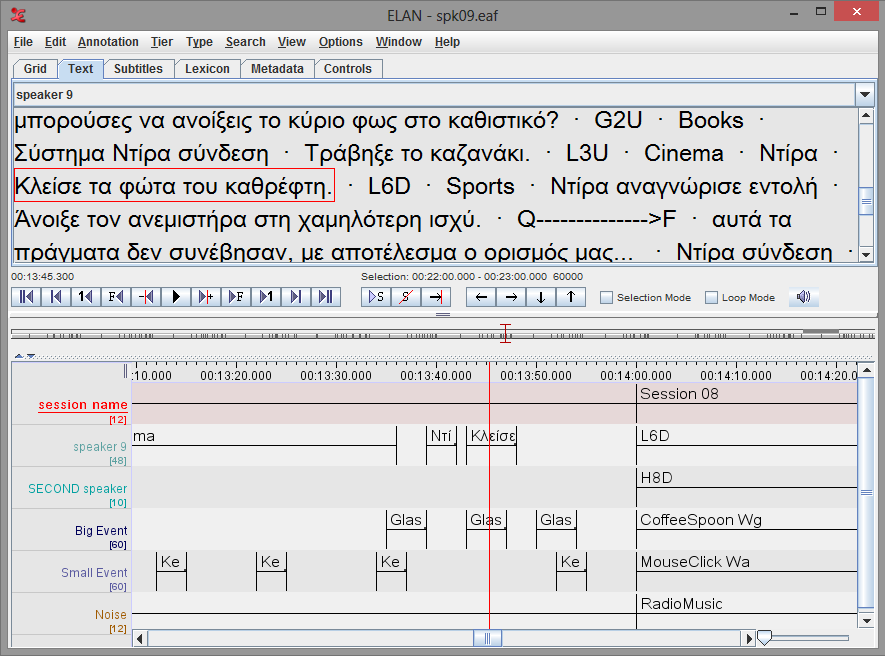
In order to maintain a ground truth reference we annotated the data and used an annotation tool named ELAN to guide the speakers during the recording process. Annotations include the speaker position, the background events type and position, the utterances, the background noise and the time stamps when each of the above mentioned events took place. A snapshot can be found in Figure 3. After the data collection we re-annotated the data in order to correct the time boundaries. |
|||||
|
|||||
Database sample |
|||||
|
You can download a sample session of our database along with its annotations following this link: | |||||
Download |
|||||
|
If you are interested in downloading the whole database please email: | |||||
If you use the corpus please cite:
| |||||